Financial Model & KPI Dashboard for a Steel Fabrication Company
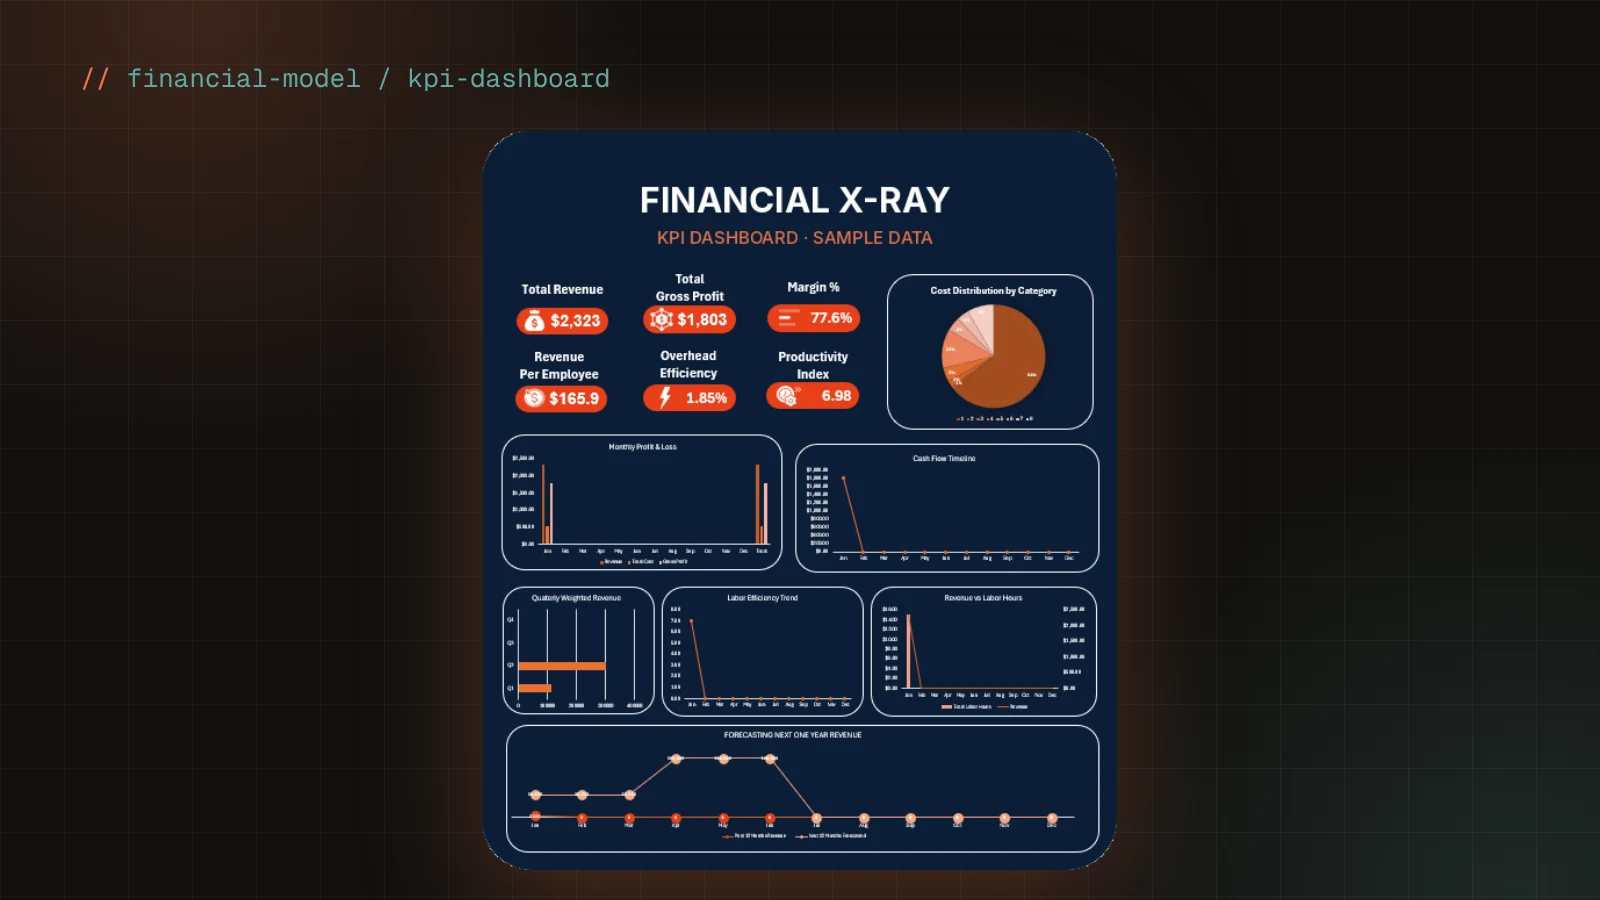
A financial decision-support model for an international steel fabrication and installation company with three divisions. From the company's Profit & Loss data across six cost categories, the model calculates monthly performance, forecasts the next 12 months, values the sales pipeline by win probability, and lets management test what-if changes to labor efficiency, material costs and headcount, all summarised on one KPI dashboard, with a data table ready for Power BI. Client details are kept confidential.
7
Dashboard charts
12 months
Forecast horizon
Live what-if
Scenario testing
Key highlights
- Monthly revenue and cost breakdown across six cost categories
- Gross profit, margin %, breakeven revenue, cash flow and labor efficiency per month
- Sales pipeline weighted by win probability, rolled up by quarter
- What-if simulator for labor efficiency, material cost and headcount
- Dashboard with 7 charts including a 12-month forecast
- Long-format data table prepared for Power BI
Technologies
More projects


Have a project in mind?
Let's talk it through.
Talk directly with our engineers. You'll leave with a rough plan, a timeline and a price range, whether or not you work with us.
- Reply within 24 hours
- Fixed-price proposal
- NDA on request
- No obligation
Lahore · PKT
--:--
same time as you
Loading
Our hours in your day
What are you building?